
 VSM Studio
VSM guide / Examples
Value stream map examples
Real current-state and future-state maps with their numbers: takt time, lead time, process cycle efficiency and the constraint. Open any of them in the free builder to explore, simulate or change it.
Example 1: a simple 4-step line
A small cut, bend, weld and pack line making 400 parts a day on one shift. Good for learning to read a map.
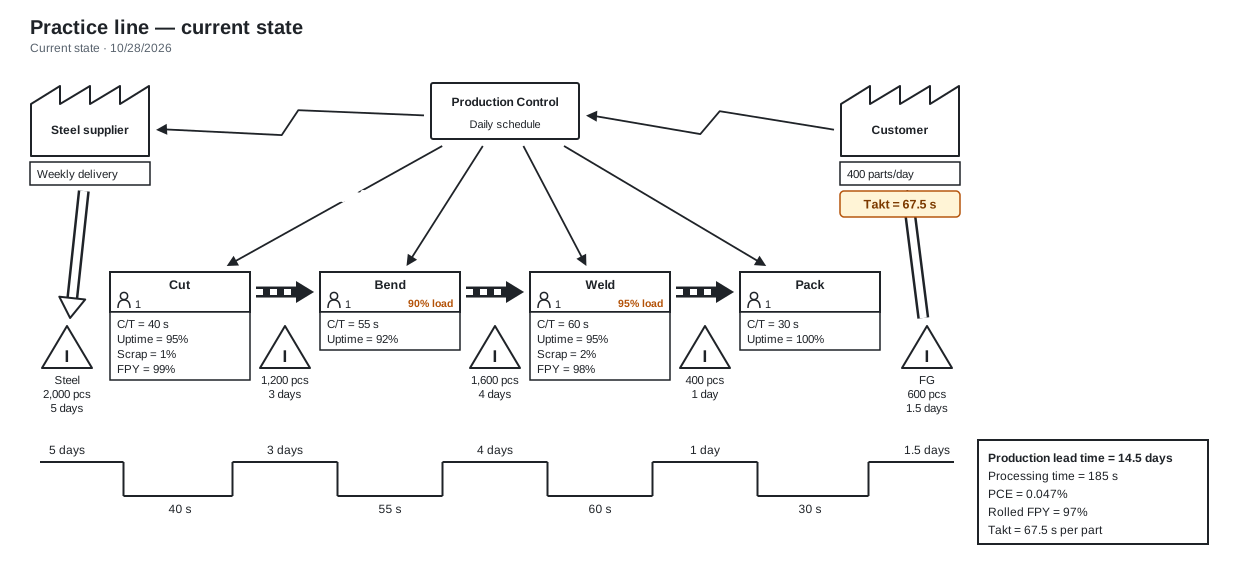
What to notice: parts wait 14.5 days for 185 s of work. Weld runs at 95% of its capacity, so any breakdown there makes the line late.
Example 2: metal brackets, current state
A five-step bracket line shipping 460 parts a day to an assembly customer on two shifts, scheduled weekly by MRP.
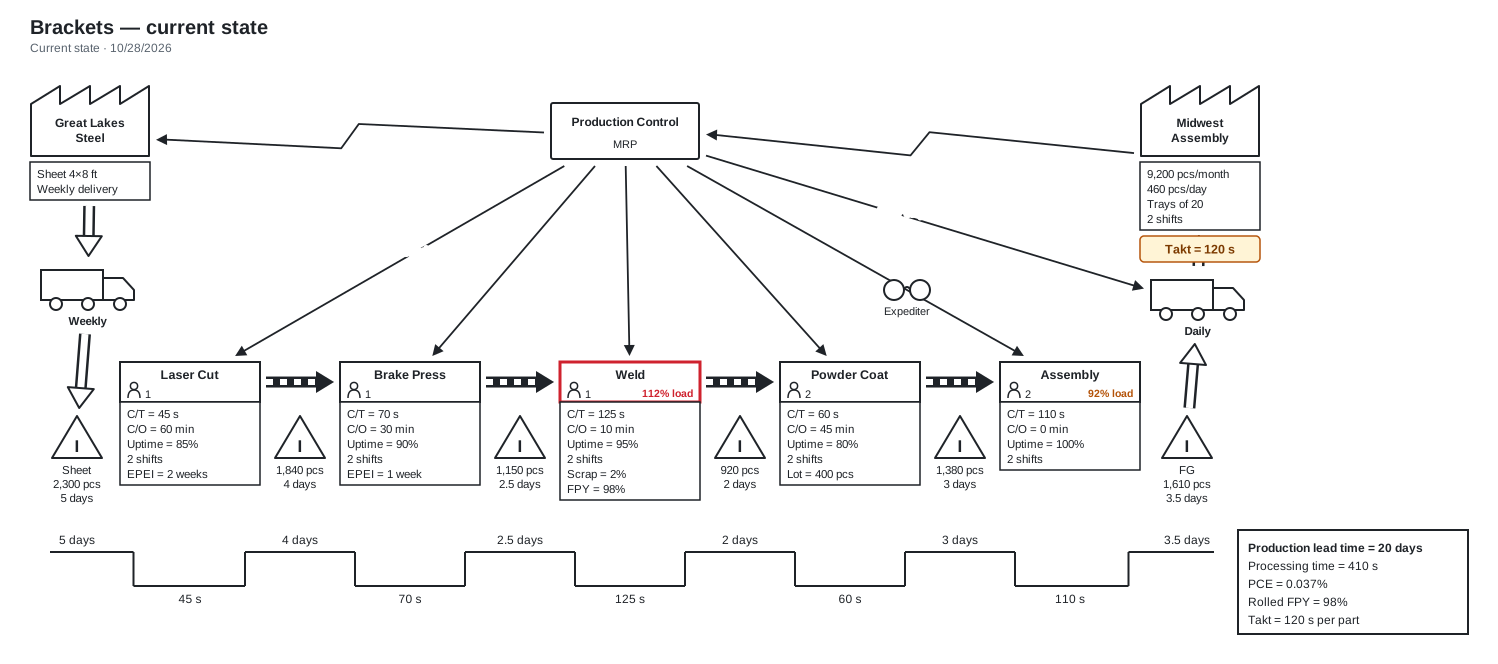
What to notice: Weld's 125-second cycle is slower than the 120-second takt, so it can't keep up (112% load). Twenty days of inventory sit between the steps for under seven minutes of work.
Example 3: the same brackets, future state
The future state for example 2: bend and weld combined into a cell, FIFO lanes and a supermarket replace push queues, and one pacemaker is scheduled with a leveling box.
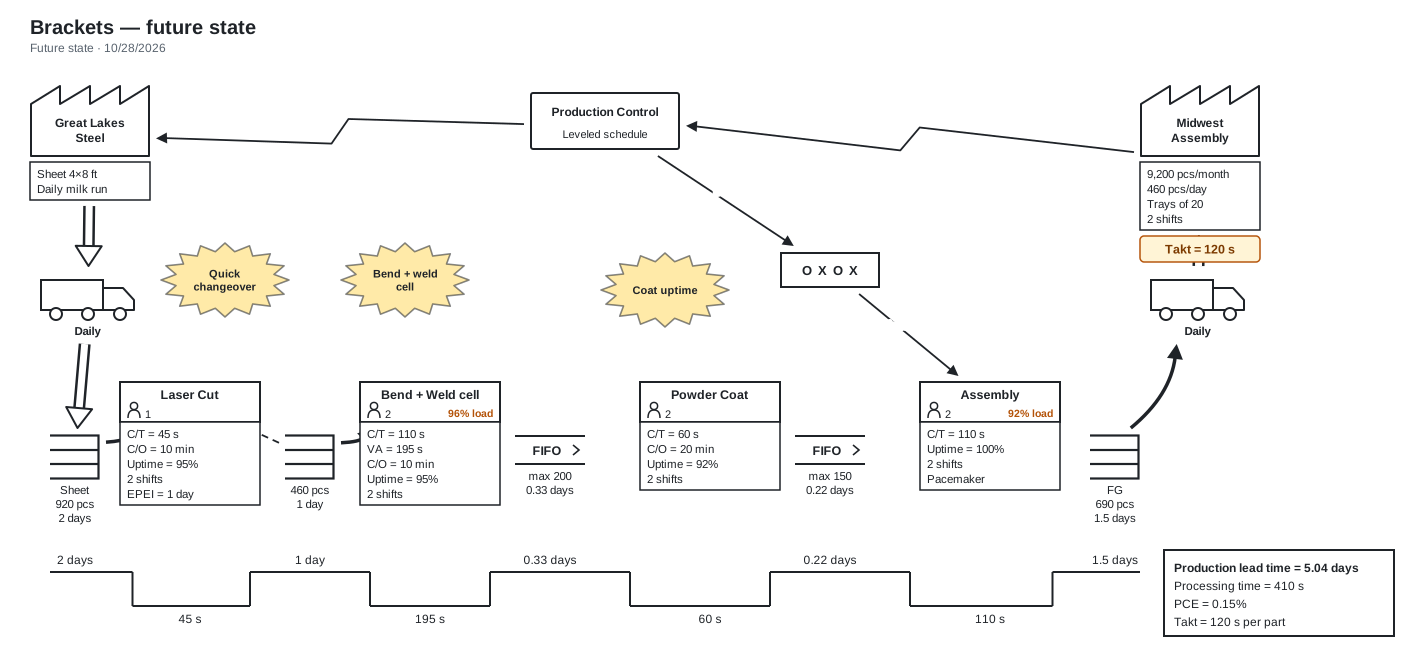
What to notice: lead time drops from 20 to 5 days with the same work content. The kaizen bursts mark each change that makes it possible.
Example 4: a 3D print shop (batch process)
Nylon parts printed in builds of 20 on six printers, with office steps (order review, build preparation) and unattended printing and cooling. Times are elapsed minutes per batch.
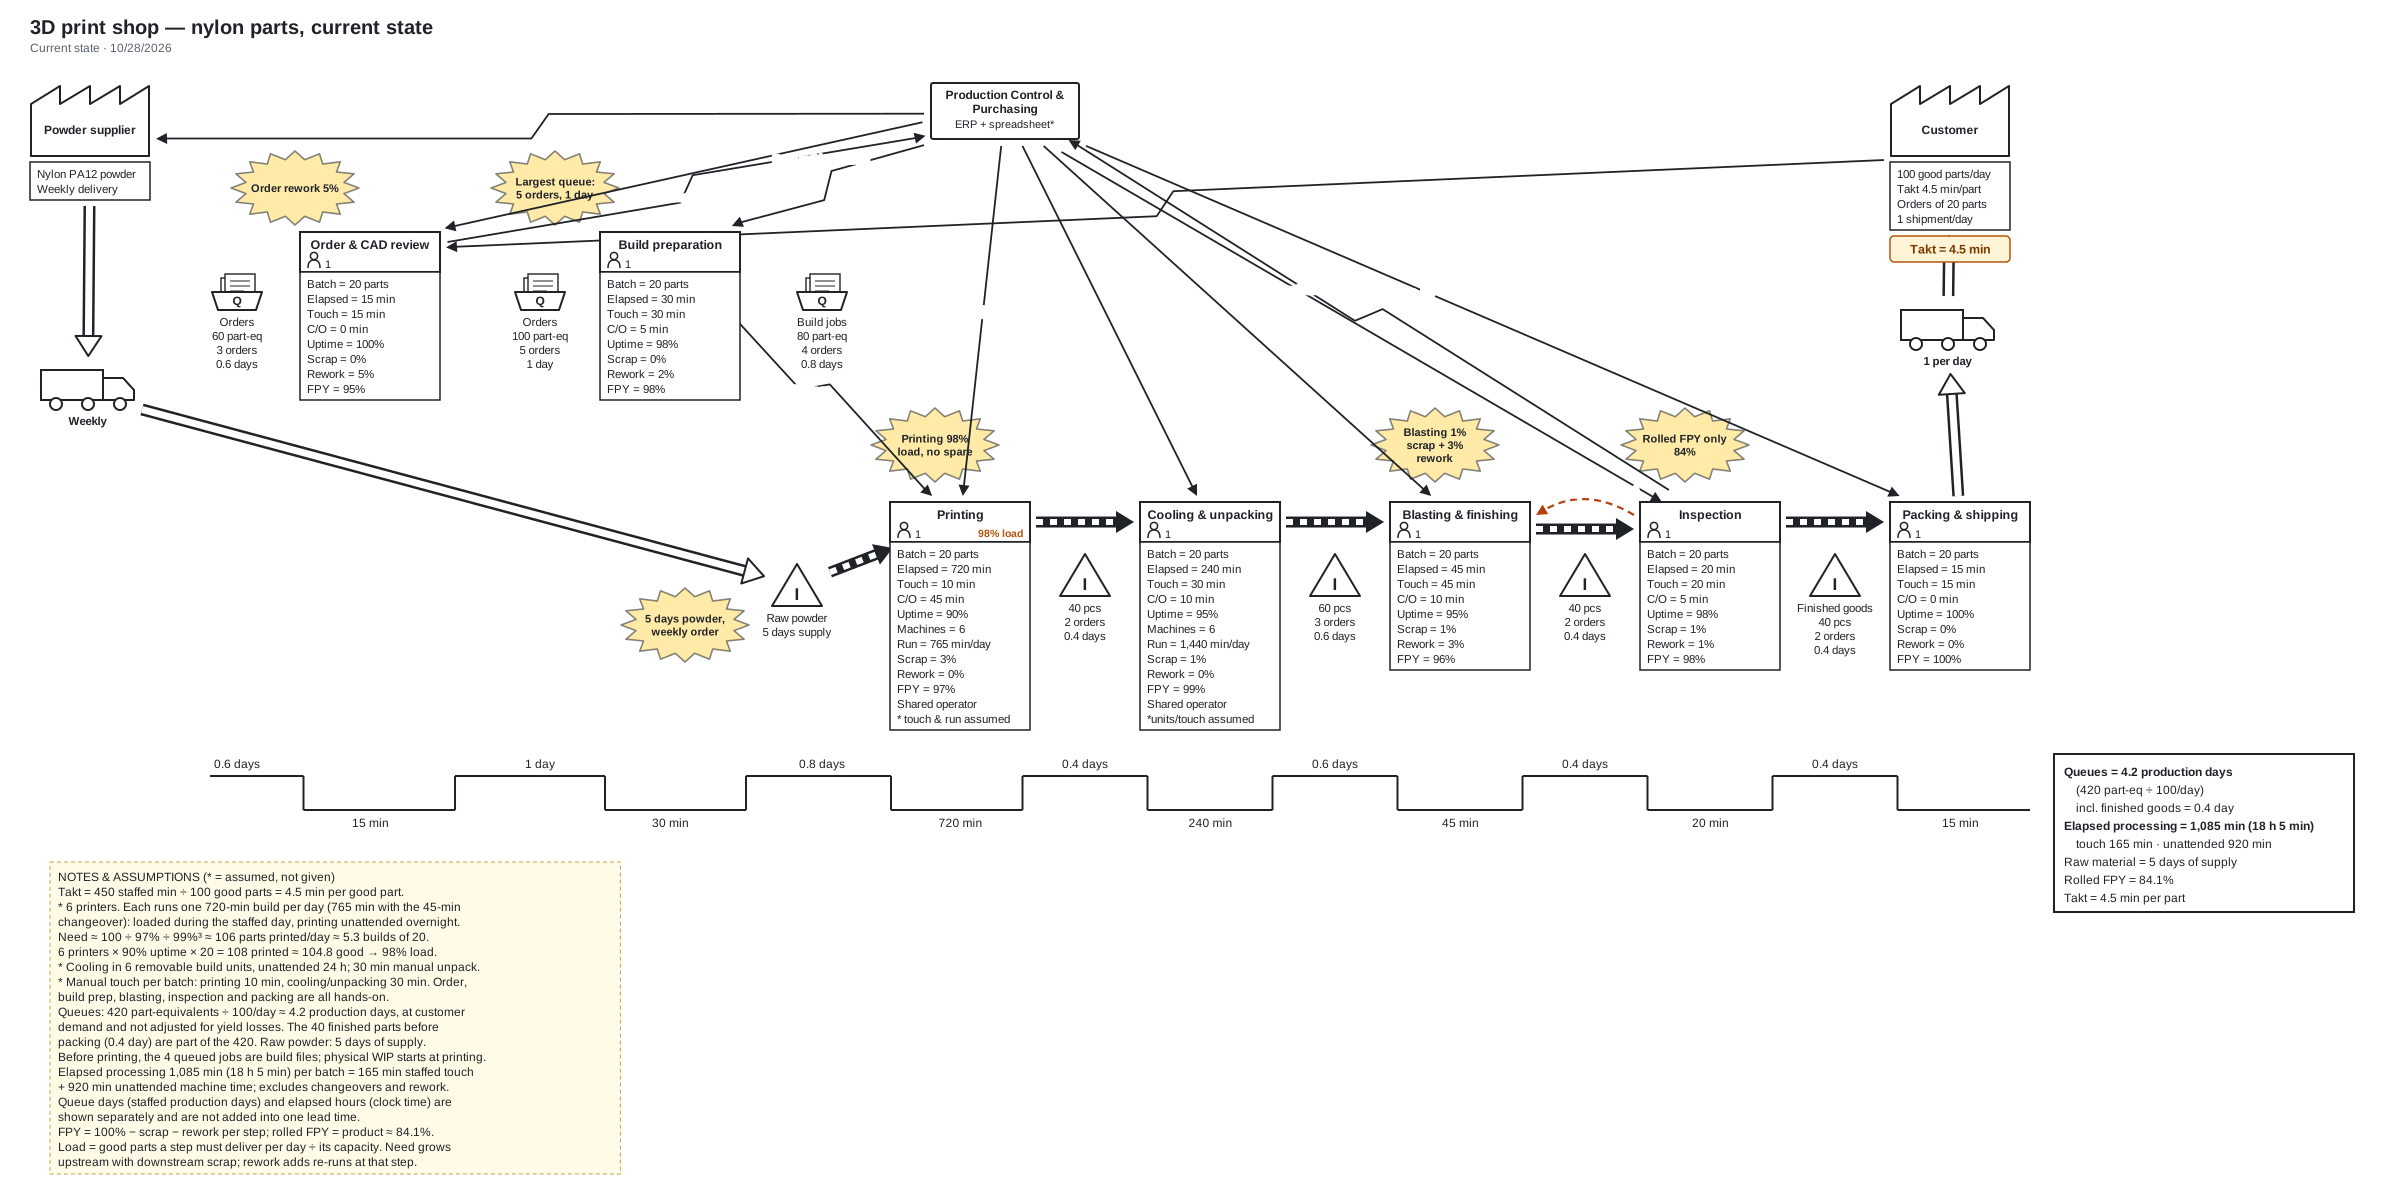
What to notice: printing runs at 98% load, the highest on the map, so it is the constraint. Rolled first-pass yield is only 84% because small losses at each step multiply, and parts spend about 4 days in queues for under 3 hours of hands-on work.
Make your own
Start from the free template, let the builder guide you step by step, or learn the method in the interactive course.